
 |
| Michael Topmiller, PhD |
For his PhD, Michael focused on the Licking River Greenway and Trails (LRGT) in Covington and asked, "How does including local perceptions of safety change how we view access to physical activity resources, especially among low-income and minority populations?"
The LRGT extends along the Licking River in Northern Kentucky, and winds through several Covington neighborhoods, including Eastside, Helentown, Austinburg, Wallace Woods, and Levassor Park. Many residents there, particularly in Eastside, Helentown, and Austinburg, live in poverty.
 |
| Study area along the Licking River Greenway and Trails. The map on the right shows the percentage of the population in poverty. |
Sidewalk Audits and Participatory Mapping Show Neighborhood Conditions
Michael enlisted Covington residents, as well as adults from the Center for Great Neighborhoods and adolescents taking part in a week-long summer digital photography class called "Youth Picture Covington" to document access points and sidewalk quality. He also asked them to share their perception of safety along the greenways, recognizing that even the best sidewalks won't be used if residents are concerned about safety.
They assessed a number of features of the built environment, including:
- Sidewalk presence: complete or incomplete
- Sidewalk condition: good, fair, or poor
- Traffic: no traffic, some traffic, heavy traffic
- Safety: safe, neutral, not safe
Neighborhood Data Mapped for Better Analysis
Michael then took participants' data and used GIS to analyze the results. He visualized both adult and adolescent data.
 |
| Mapped data showing locations of complete sidewalks. |
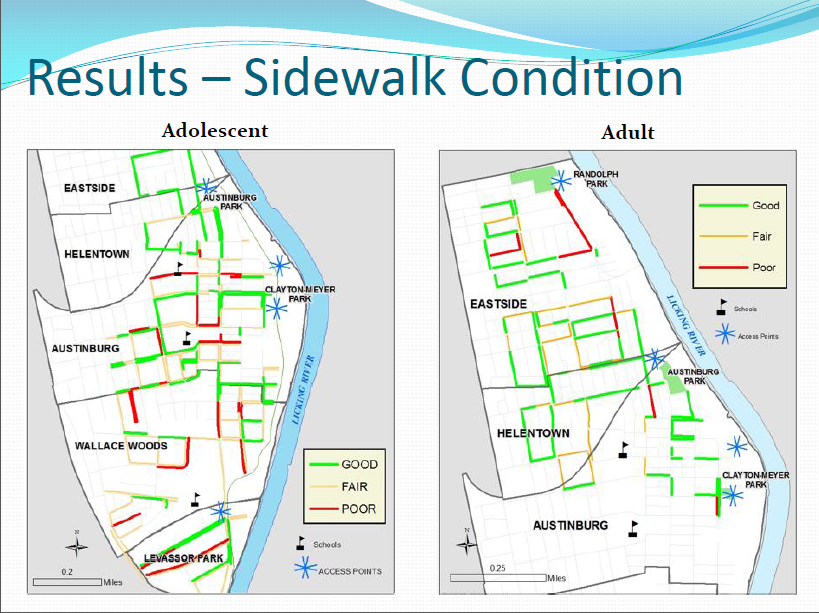 |
| Mapped data showing sidewalk conditions in study area. |
 |
| Mapped data of local residents' perceptions of traffic volume in study area. |
 |
| Mapped data of local residents' perceptions of safety in study area. |
 |
| Findings analyzed and mapped against poverty levels. |
Lessons Learned
Michael's research identified many positives:
- Good proximity of access points to neighborhoods and schools
- Good presence and quality of surrounding sidewalks
- High perception of poor safety and high traffic near schools and access points
- Barriers to access are more prominent in under-resourced neighborhoods
Michael will be presenting several upcoming HealthLandscape webinars. He'll also be glad to answer questions about his research during the webinars.
Register today to see how GIS visualization can help you see your neighborhoods in a new light.
The Community Data Portal
In-depth demonstration of our award-winning data dissemination tool
Tuesday, December 10, 2:00 pm EST
Tuesday, December 10, 2:00 pm EST

Visualizing Data with HealthLandscape
Overview of all of our data visualization tools, including the Site Performance Explorer
Tuesday, December 17, 2:00 pm ET
Tuesday, December 17, 2:00 pm ET
Introduction to HealthLandscape
In-depth instruction on using HealthLandscape, our free online mapping tool and data library
Tuesday, January 7, 2:00 pm ET
Tuesday, January 7, 2:00 pm ET
No comments:
Post a Comment