Showing posts with label Community Data Portal. Show all posts

Monday, December 16, 2013

New Data Portal Feature: Clustered Points for Multi-Site Locations

Think about your last visit to your doctor. Did you go to a medical office building or to a standalone practice?

The United Way of Greater Cincinnati shares the same address as the Visiting Nurses Association, Local Initiatives Support Corporation (LISC), and several affiliated United Way agencies.

So what, you're saying. Who cares?

Well, if you're mapping data, you should.

You see, some GIS data viz tools get confused when multiple agencies share the same physical address. They can only display one point on the map, so they pick one, usually the one "on top," the one the underlying code accesses first.

This isn't good.

Why? Because when you click on the point, you see data for only one agency, not every agency at that address. You get results for one clinic, not for every clinic in the building. The results can be incomplete at best, misleading at worst.

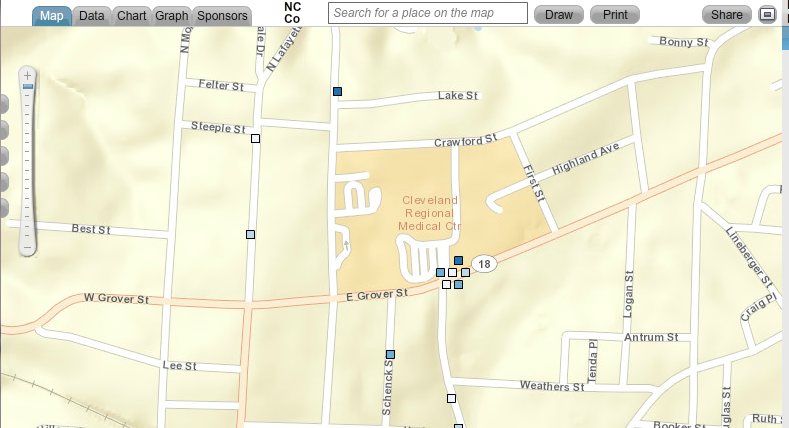
A screen shot showing one point that represents multiple sites.
The point could represent multiple clinics, physician practices, or social service agencies that all share the same address.


That's why we've added a new feature called clustered points to our Community Data Portal. It's a behind-the-scenes feature, one you don't have to access or configure in any way.

When you click on a point that has multiple sites, the points spread out. Each point becomes clickable, and each site's unique data becomes visible. You see all data relevant to that location, not just a portion of it.


Map showing clustered points. When you click on a point that represents multiple sites,
the points spread out, showing data for every site at that location.


The Community Data Portal is but one way to map population data. Register today for one of our free HealthLandscape webinars to learn more about GIS data visualization.


Visualizing Data with HealthLandscape
Overview of all of our data visualization tools, including the Site Performance Explorer
Tuesday, December 17, 2:00 pm ET
Introduction to HealthLandscape
In-depth instruction on using HealthLandscape, our free online mapping tool and data library
Tuesday, January 7, 2:00 pm ET
The Community Data Portal
In-depth demonstration of our award-winning data dissemination tool
Tuesday, January 14, 2:00 pm ET

Wednesday, August 21, 2013

7 Ways Data Sharing Can Make Your Organization Stronger


Sharing data with your community
can provide tangible benefits for your organization.

Photo ©iStockphoto.com/Peter Booth and Alexandra Booth

We hear a lot about data these days: big data, open data, proprietary data, market data, metadata.

But we don't hear a lot about data sharing. At least not in business or nonprofit circles.

Data sharing is fairly common among university and research institutions who see their data as a public asset. Federal, state, and local governments have begun to step up and release useful data sets. But beyond institutional walls, there is still widespread reticence against letting anyone outside the organization have access to "our" data.

So why would you, as a private company or nonprofit, want to share your data?


1. It makes your data more valuable. 


Your data is just that: your data. By adding your data to others', a fuller picture emerges of what is really happening in your market, industry, or community. This is true whether you formally "pool" your data into a data portal, or simply compare your data against other data sets.


2. It promotes collaboration.


Data sharing helps you choose partners wisely. You're a business owner, and until you sought out that specific data set, you did not realize that Company X had the potential to be an excellent strategic partner. You're a nonprofit executive director just beginning to realize the power of collective impact. By opening up your data, you can more easily answer the question, "Who else is working in this field?"


3. It promotes innovation.


Building 20 at MIT became well-known as an incubator for innovation. Educators and researchers from disparate fields occupied the space, and in the natural course of their workday, they bumped into each other. Through conversations and generally taking an interest in one another, new ideas sprang forth, ideas which may not have come about otherwise.

The same can occur when you share your data. You may inadvertently generate a new app, a new insight, or a new way of looking at the world because you generously made your data available to all.


4. It demonstrates your organization's transparency. 


Every organization has a level of accountability. Businesses must be accountable to their shareholders and consumers; nonprofits must be accountable to their donors and constituents. All must be accountable to their community.

By willingly sharing your data with the community at large, you demonstrate that you are willing to be accountable for your organization's strengths, you are willing to accept responsibility for areas that need improvement, and you are open to being vulnerable to both praise and criticism. All of these actions help to build trust.


5. It enlarges your worldview. 


When you're the only one looking at your data, you can only see things from your point of view. By exposing your data to the rest of the world, you invite comment--and insight. Viewers outside your organization bring their own experience to your data, and may be able to give you a new perspective that might never have been realized had the data been kept internal.


6. It's a two-way street.


Data sharing begets data sharing.Your courage in stepping out will invite others to do the same.


7. It makes things happen.


Data sharing doesn't have to be passive. Host a hackathon to build that elusive app you've been putting off for months. Sponsor a data visualization contest around your data. Tell the data viz team the concept you're trying to express, and let them have a go at it. Design an event that matches creativity to a legitimate need and see what emerges. If nothing else, you've built goodwill and had fun in the process.

We're not suggesting that you release all of your data. Or confidential data. Just data that could benefit the community as a whole. And of course you must employ some safeguards. In a future post, we'll give you some guidelines on how to cleanse and de-identify your data, so that you can share your data with confidence.

Have a specific question about making your data accessible? Contact us at info@healthlandscape.org.

Or visit www.HealthLandscape.org to sign up for a Community Data Portal webinar. (Next one is tomorrow, August 22 at 3:00 pm ET. Click here to register.)

Friday, May 17, 2013

Using Facts Matter to Map Mental Health Status in Greater Cincinnati

In recognition of National Prevention Week, we are drawing attention to health issues related to substance abuse and prevention. National Prevention Week is an annual health observance designed to increase public awareness of, and action around, substance abuse and mental health issues. This year's theme is: "Your voice. Your choice. Make a difference."


Facts Matter is a data portal created by HealthLandscape and funded by the United Way of Greater Cincinnati, The Greater Cincinnati Foundation, The Health Foundation of Greater Cincinnati, and the Haile/U.S. Bank Foundation to support the region's collective impact efforts. Multiple organizations contribute indicator data, which can be displayed at the county, tract, or neighborhood level.

The map below shows the region's mental health status. Data comes from the Health Foundation of Greater Cincinnati/Greater Cincinnati Community Health Status Survey and reflects the quality of life or function as influenced by mental conditions.

Facts Matter map view. Darker shading represents better mental health status.


Mapped data can also be shown in a chart or graph:

Facts Matter chart view.


Facts Matter graph view.

Is your community following the community impact model to promote change and well-being? What tools are you using to collect and share local data? Post a comment below to join the conversation.

HealthLandscape data portals like Facts Matter are deployed nationwide and internationally. They can display any kind of population data: community health needs assessment data, community benefits data, hospital quality and population data, educational readiness data, and more. If you would like to learn how your organization can get a data portal up and running in your community, please contact us at 513.458.6722 or send an email to info@healthlandscape.org. You can also sign up for a "Community Indicator Data Portal" webinar at www.HealthLandscape.org.