Showing posts with label HealthLandscape. Show all posts

Wednesday, October 7, 2015

Looking Inward, Looking Outward

Looking Inward: How we measure and use Vital Signs

'Hæmostaticks' and the History of Blood Pressure

In the early years of the 18th century, Stephen Hall began experiments involving horses, brass pipes, and eight foot lengths of glass tubing, that allowed him to measure the force exerted by the horse’s heart with each beat.  These somewhat gruesome experiments would lead to what we know today as the measurement of blood pressure.  Several hundred years of experimentation with various invasive and non-invasive measures and machines ultimately led us to the modern Sphygmomanometer, which provides accurate measures of blood pressure without the inconvenience of spurting blood and the accompanying mess.

Blood pressure is a common Physical Vital Sign, measured routinely in physicians’ offices, hospitals, and even in patient homes for routine blood pressure monitoring.  The standard Sphygmomanometer, with glass tubing and mercury, is quickly being replaced with digital devices that quickly provide accurate measurement.  We understand how a person’s age, weight, body temperature, and even body positioning impact blood pressure.

Just as important as accurate measurement, this information is actionable.  

Blood pressure is a common and critical measure of a person’s physical health and we’ve developed detailed goals and treatment plans that include include both pharmacological and nonpharmacological approaches.  We know when a person is prehypertensive, we know when to expect elevated results (after trauma or while smoking), we know how much medication to give at certain levels of hypertension, and when it can be reasonably controlled with diet and exercise.

It has been 300 years in the making, but we’ve gotten very good at using this important Physical Vital Sign.

Looking Outward: How can we measure and use Community Vital Signs?

We’re now on the cusp of a new direction in healthcare, by looking outward at the community where an individual lives, works, plays, and travels.

We know that poverty is an important community vital sign that impacts a person's health, but we have much to learn.  Are we measuring poverty correctly?  Should we focus on individual/household poverty, or poverty level of their community?  What IS community?  Is community their immediate neighborhood, their city, their county?  When we measure poverty, do we really want to know availability of economic resources, better measured by wealth?  Is economic capital more or less important than social capital -- the intangible, usable social networks a family can take advantage of?  What about walkability?  Residential segregation?  More comprehensive summary measures in the Social Deprivation Index developed by researchers at Australian National University and the Robert Graham Center?

We’ve learned a lot in recent decades, but we have along way to go, before we can match the success of Stephen Hale and his original 'Hæmostaticks' research.

Where do we go from here?

This is not meant to be at all discouraging.  This is an incredibly exciting time to be doing research on social determinants of health, or what we refer to as Community Vital Signs.  We’re collaborating with organisations like the Robert Graham Center and OCHIN to tackle this field of study, by creating innovative tools like the HealthLandscape Geoenrichment API, which can be used to geocode and enrich patient records to include a host of Community Vital Signs

We’re also developing web-based applications that present the Community Vital Signs data in clinical environments to help healthcare providers integrate the social and medical needs of patients, to improve community and patient care.

Mark Carrozza
Director
HealthLandscape


Related Reading:

Thursday, August 27, 2015

Population Health Mapper Wins at ESRI User Conference!


HealthLandscape is recognized as one of the top three GIS applications at the ESRI 2015 User Application Fair.

HealthLandscape is privileged to regularly attend and WIN at the User Application Fair for the fifth year in a row. Our very own Jene Grandmont presented the Health Landscape Population Health Mapper.  The Population Health Mapper enables users to select metrics from the seven categories and use a slider bar to set thresholds. By default, thresholds are set at values that represent national benchmarks.  The tool will highlight those counties that are outside of the national benchmark, or will incrementally shade or remove counties depending on how the user modifies the thresholds for selected indicators.  A huge thank you to everyone who participated and allowed us to continue on our winning streak! 

2015-08-26_1542.png

See our account from the ESRI User Conference 2015 here: http://healthlandscape.blogspot.com/2015/08/report-from-esri-user-conference-2015.html 

Claire Meehan
User Engagement Specialist
HealthLandscape


Learn more about the Population Health Mapper Tuesday September 9th at 11:00AM!


Learn more about HealthLandscape with our online Webinars and Training

Thursday, September 27, 2012

Primary Care Physician Mapper App Launched

Explore the distribution of primary care physicians by state, county, or census tracts (in metropolitan areas) with the new Primary Care Physician Mapper.

The Primary Care Physician Mapper uses National Provider Identifier (NPI) data, and displays information for any provider who bills Medicare, Medicaid, or certain private insurance companies.

Users can visualize raw counts of physicians or create maps showing the ratio of one or more primary care specialties to the population within a selected geography.

The app, developed by HealthLandscape, is a project of the Robert Graham Center. There is no cost to users. For more information contact us at info@healthlandscape.org or visit www.HealthLandscape.org.


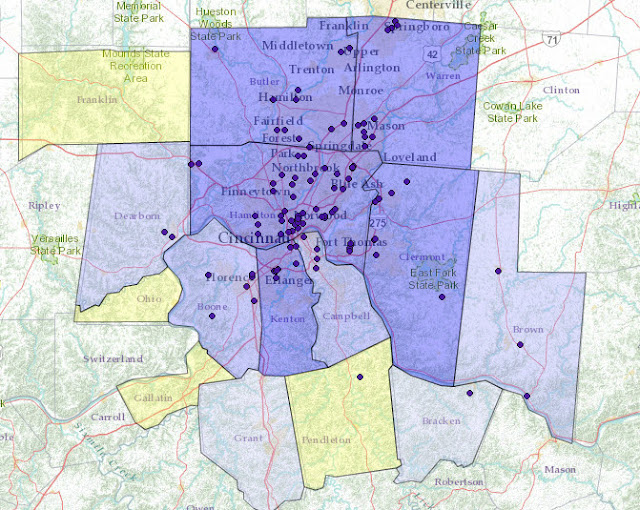
County-level map displaying the population to pediatric physicians in the Greater Cincinnati, Ohio, region.


Census tract-level map displaying the population to pediatric physicians with a threshold of at least 350 persons per provider in the Greater Cincinnati, Ohio, region.


Map displaying number and location of pediatricians in the Greater Cincinnati, Ohio, region.

Friday, April 27, 2012

We're Previewing Our Community Indicators Data Portal at United Way Community Leaders Conference

HealthLandscape specializes in creating data portals that make community data accessible, updatable, and interactive. (Check out our website for a few featured portals.)

The West Virginia Data Portal displays community indicators related to population, children and youth, educational attainment, health, and economy. The map above shows two indicators: per capita market income for 2009 (left) and 2012 Health Factors Rank (right).

We'll be previewing our Community Indicators Data Portal next week at the United Way Community Leaders Conference in Nashville.

Organizations like the United Way amass a lot of data, especially community indicator data. A community indicator is a way of measuring the health and well-being of a community. There are no standard indicators; typically, community organizations come together and work cooperatively to determine what needs to be measured and how they can do so.

Indicators can vary widely. They may include such measures as:
  • Requests for assistance with basic needs such as rent or utility payments
  • Food bank or food stamp usage statistics
  • Unemployment statistics
  • Home foreclosures
  • Infant mortality
  • Childhood overweight and obesity
  • Chronic diseases
HealthLandscape takes community indicator data (which is usually presented in table or graph form), and deploys it on our HealthLandscape mapping platform. The data comes alive, because:
  • It's given context: People understand the data in relationship to where they live
  • It's not static: Indicators can be overlaid and compared
  • It's visualized: What is difficult to see in a table becomes obvious on a map
How does your community measure its health and well-being? And how would a map make it easier to see?

Monday, April 16, 2012

How One Person Used Mapping to Improve Community Health

The Health Foundation of Greater Cincinnati (one of HealthLandscape's sponsoring organizations) and The Foundation for a Healthy Kentucky recently co-sponsored an event called "The Hot Spotter's Agenda: Targeting Resources to Achieve Quality Care." Keynote speaker was Dr. Jeffrey Brenner, a primary care physician in Camden, New Jersey.

Dr. Brenner's dramatic story is told in a 2011 New Yorker article by Atul Gawande. Dr. Brenner, who was on track to become a neuroscientist, instead changed his vocational focus after volunteering one day a week in a free primary care clinic during medical school. After seeing how patients were treated--or not, in one case--he became curious about the relationship between crime "hot spots" and health care delivery. He used maps to plot the data. Although he did not persuade city leaders to implement solutions based on his findings, he continued to collect and examine data and look for medical usage patterns using maps.

He made many discoveries. For example, he located the two blocks that accounted for more healthcare costs than any other in the city--totaling more than $200 million in healthcare bills in a 5.5-year period. He found that a single building sent more people to hospitals as a result of serious falls than any other, totaling almost $3 million in healthcare costs.

Dr. Brenner made meaningful use of the data. He has subsequently poured his efforts into the Camden Coalition of Healthcare Providers, an organization he founded to treat "superutilizers." His team has successfully built relationships with the patients they serve, and the Coalition's care has resulted in significant reductions in healthcare costs.

Click here to view Dr. Brenner's keynote entitled, "Bending the Cost Curve and Improving Quality in One of America's Poorest Cities." Also presenting are Greg Moody and Eric Friedlander, who give Ohio and Kentucky regional perspectives to the concept of "hot spotting."