
GIS Day has been celebrated annually on the third Wednesday of November since 1999. Over the past 16 years, it has grown from a small, informal celebration to an international phenomenon, with over 1,000 events taking place around the world.

The goal of the celebration is to show off all of the amazing things that can be done with GIS. Organizations and companies across multiple industries use the same technology to tell their very different stories, and this gives us a chance to take a look around and see what's going on in the world around us.
Head over to Twitter and browse through the #GISDay posts to find new and interesting ways that GIS is helping us to understand our world. Some of my personal favorites:
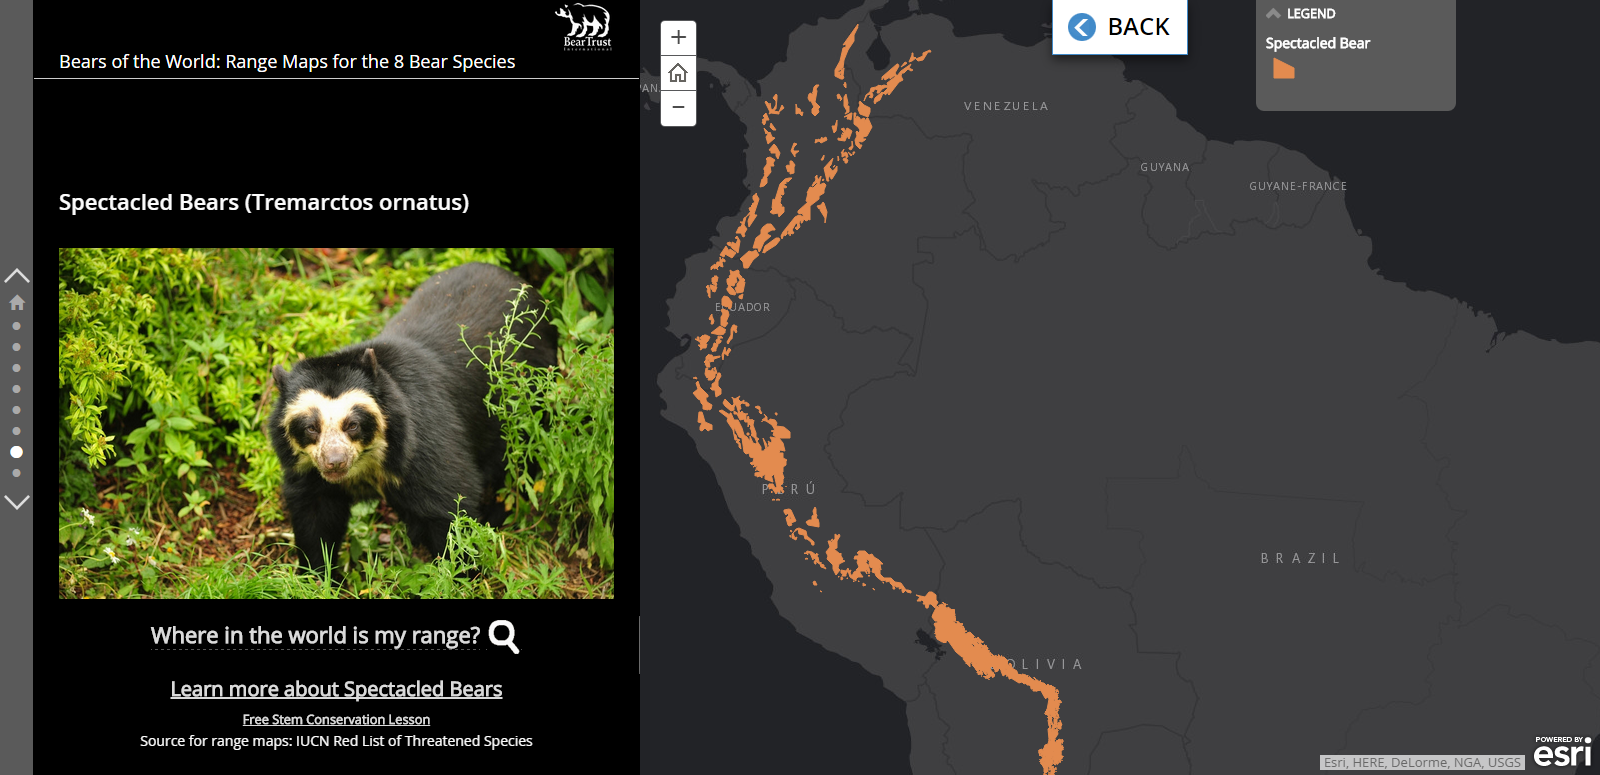
The Bear Trust International Bears of the World story map, created by our friends at Blue Raster. The Bear Trust wanted to create lessons centered around bear research and ecology.

The MapED open data homepage - a central location for accessing the vast data collections of the US Department of Education, National Center for Education Statistics.

This Climate Connections map, and the rest of the ISTE Mapping collection housed by PBS.

When it comes to GIS, there really is something for everyone, wherever your interests lie.
Jené Grandmont
Senior Manager, Application Development and Data Services
HealthLandscape

The goal of the celebration is to show off all of the amazing things that can be done with GIS. Organizations and companies across multiple industries use the same technology to tell their very different stories, and this gives us a chance to take a look around and see what's going on in the world around us.
Head over to Twitter and browse through the #GISDay posts to find new and interesting ways that GIS is helping us to understand our world. Some of my personal favorites:
The Bear Trust International Bears of the World story map, created by our friends at Blue Raster. The Bear Trust wanted to create lessons centered around bear research and ecology.
The MapED open data homepage - a central location for accessing the vast data collections of the US Department of Education, National Center for Education Statistics.

This Climate Connections map, and the rest of the ISTE Mapping collection housed by PBS.

When it comes to GIS, there really is something for everyone, wherever your interests lie.
Jené Grandmont
Senior Manager, Application Development and Data Services
HealthLandscape