Wednesday, September 2, 2015

Hospitals Located in Distressed Counties in Appalachia Disproportionally Affected by Readmission Penalties


The Hospital Readmissions ReductionProgram (HRRP) requires hospitals to pay penalties if Medicare readmissions for common diagnosis are too high.  Despite increasing evidence that readmissions are more a result of social factors largely outside the control of hospitals, readmission rates and penalties are not risk-adjusted for socio-economic factors.  Not surprising given the socio-economics of the region, safety-net hospitals in the Appalachian region have higher readmissions and are more likely to receive higher penalties, with hospitals located in the most distressed counties of the region having the highest rates and most severe penalties.  These results highlight the importance of risk-adjusting for socio-economic factors for under-resourced regions and provide insights into the potential impacts of payment reform on safety-net clinics.
In an effort to control Medicare costs, the Hospital Readmissions Reduction Program was created as part of the Affordable Care Act.  The program requires hospitals to pay penalties if readmissions for common diagnosis such as Acute Myocardial Infarction, Heart Failure, Pneumonia, COPD, and Hip/Knee Replacement are too high. The HRRP has been levying fines on hospitals since the 2013 fiscal year, with maximum fines increasing from a 1% reduction in base Medicare Inpatient claims payment (in 2013) to a 3% maximum reduction in 2015. For fiscal years 2015 and 2016, close to 4 in 5 hospitals in the U.S. were fined for excess readmissions, though the majority received fines of less than 1%.
The first few years of data from the HRRP have shown that safety-net hospitals are more likely to receive higher penalties, with data indicating that factors affecting readmissions are largely outside the control of hospitals (Gu et al., 2014).  This is particularly troublesome for the Appalachian region, which has higher rates of poverty, less education, and worse health outcomes when compared to the United States as a whole (Appalachian Regional Commission, 2015).  A recent Kaiser Health News report noted that four hospitals have received the maximum readmission penalty all four years of the program, with three of these hospitals located in the Appalachia region (Kaiser Health News, 2015).  For the fiscal year 2016, about one-third of the 38 hospitals receiving the maximum penalty were located in Appalachia.  

Hospital Readmission (FY 2015) & Dual-Eligible Status (County)

# Hospitals (%)
% Dual Eligible (County)
% Readmission Rate (Hospital)
All (Appalachia)
475
23.0
15.7
No - Penalty
48 (10.1%)
21.3
14.7
Yes - Penalty
427 (89.9%)
23.2
15.8
Penalty >= 1%
108 (22.7%)
25.9
16.5
Penalty >= 2%
32 (6.7%)
30.6
16.9
Penalty = 3%
17 (3.6%)
32.0
17.5
 Source: CMS Final Rule MRRP, 2015; CMS Geographic Variation PUF, 2013; Appalachia Data Portal

Using a combination of web-based mapping and data visualization tools, we examined whether hospitals in Appalachia are more adversely affected by the HRRP than hospitals outside the region.  The table above shows the relationship between hospital readmissions (at the hospital level) and dual-eligible for Medicaid population (at the county-level).  Overall, almost 90% of hospitals in Appalachia were penalized for excess readmissions in 2015 (compared to about 80% for the U.S.), with more than 20% receiving fines of 1% or greater.  Moreover, hospitals with high readmission rates were located in counties with higher percentages of dual eligibles, with the largest fines levied against those hospitals located in counties with dual eligible populations of greater than 30%. The image below displays the difference in the percent of dual eligibles for the county in which the hospitals are located by whether the hospitals received a 2% fine or greater.

Source: CMS Final Rule MRRP, 2015; CMS Geographic Variation PUF, 2013; Appalachia Readmissions Explorer

There are also clear geographic patterns within Appalachia.  Hospitals with fines of greater than 2% are concentrated in central Appalachian, which is the most distressed region in Appalachia, with high rates of poverty and unemployment, and low rates of education.  Further, half of all the hospitals located in Appalachia that received fines of 3% in 2015 were located in distressed counties.

Appalachian Regional Commission, County Economic Status FY2016 (Distressed Counties in Red)

Source: Appalachia Data Portal & Readmissions Explorer

The Hospital Readmissions Reduction Program (HRRP) has been criticized for not risk-adjusting for the socio-economic circumstances of the populations that they serve, despite increasing evidence of readmissions being driven by factors largely outside the control of hospitals.  While there has been some movement towards risk-adjusting for socio-economic factors (the National Quality Forum has begun a two-year pilot studying the potential for risk-adjustment of socio-economic factors and the U.S. Senate has introduced a bill to incorporate socio-economic factors), changes to the penalties do not seem imminent.  Policy-makers need to consider risk-adjusting for social determinants of health and geographic variation for hospital readmissions, while also applying lessons learned when moving towards value-based payments for physicians and the detrimental impact that not risk-adjusting may have on safety-net clinics.

HealthLandscape Web-Based Data Visualization Tools

We used a combination of web-based mapping and data visualization tools, including the Appalachia Readmissions Explorer and the Appalachia Data Portal.  The Appalachia Readmissions Explorer is an interactive mapping tool that allows users to quickly compare readmissions for hospitals in the Appalachian Region.  Hospitals are colored red, yellow, or green – based on whether hospitals have readmissions worse, no different, or better than national average for all-cause readmissions and for the individual diagnosis of Heart Failure, Heart Attack (AMI), Pneumonia, COPD, Stroke, and Hip/Knee Replacements.  Mortality data have also been added which allows users to explore readmissions and mortality rates.  Users can also filter by whether a hospital was fined for excess readmissions in 2015, the percent amount of fine, and by whether a hospital received a penalty as part of the Hospital Value-Based Purchasing (HVBP) Program.  In addition, users can use the Stats tool to perform statistical analyses to explore relationships between hospital readmissions and mortality rates and population health indicators for the county in which the hospital is located. 

The Appalachia Data Portal is an online tool for exploring demographic, education, income, and health disparities for the 420 counties in the Appalachian region. The data included in the Appalachia Data Portal come from a variety of sources, including the American Community Survey, the Appalachian Regional Commission, the Robert Wood Johnson County Health Rankings, and the Centers for Medicare & Medicaid. The tool allows users to visualize economic, demographic, and other types of data for the Appalachian region using maps, graphs, and trend charts.  Users also have the ability to examine the relationship between two indicators (for example, Diabetes and Poverty) with side-by-side maps and a comparison tool that uses percentiles to visualize the relationship between variables.  The Appalachia Data Portal provides multiple methods for exploring population indicator disparities throughout the Appalachian region, and is a helpful tool for identifying health disparities and bright spots within the region.


Michael Topmiller
Health GIS Research Specialist 
HealthLandscape 


To access the Appalachia Data Portal and Appalachia Readmissions Explorer, please visit http://www.healthlandscape.org/AppalachiaDataPortal/map.cfm

More information about the data sources are available at:
Medicare Hospital Readmissions Reduction Program:

Appalachia Regional Commission County Economic Status:


References:
Appalachia Data Portal & Appalachia Readmissions Explorer
Appalachian Regional Commission (ARC), 2015.  County Economic Status Reports. http://www.arc.gov/appalachian_region/CountyEconomicStatusandDistressedAreasinAppalachia.asp
CMS Final Rule Medicare Readmissions Reduction Program (MRRP), 2015

CMS Geographic Variation Public Use File (PUF), 2013

Gu, Qian, Lane Koenig, Jennifer Faerberg, Caroline Rossi Steinberg, Christopher Vaz, and Mary P. Wheatley. 2014. The Medicare Hospital Readmissions Reduction Program: Potential Unintended Consequences for Hospitals Serving Vulnerable Populations. Health Services Research, 49(3): 818-833.
Kaiser Health News – “Half of Nation’s Hospitals Fail Again to Escape Medicare’s Readmission Penalties”
http://khn.org/news/half-of-nations-hospitals-fail-again-to-escape-medicares-readmission-penalties/

Thursday, August 27, 2015

Population Health Mapper Wins at ESRI User Conference!


HealthLandscape is recognized as one of the top three GIS applications at the ESRI 2015 User Application Fair.

HealthLandscape is privileged to regularly attend and WIN at the User Application Fair for the fifth year in a row. Our very own Jene Grandmont presented the Health Landscape Population Health Mapper.  The Population Health Mapper enables users to select metrics from the seven categories and use a slider bar to set thresholds. By default, thresholds are set at values that represent national benchmarks.  The tool will highlight those counties that are outside of the national benchmark, or will incrementally shade or remove counties depending on how the user modifies the thresholds for selected indicators.  A huge thank you to everyone who participated and allowed us to continue on our winning streak! 

2015-08-26_1542.png

See our account from the ESRI User Conference 2015 here: http://healthlandscape.blogspot.com/2015/08/report-from-esri-user-conference-2015.html 

Claire Meehan
User Engagement Specialist
HealthLandscape


Learn more about the Population Health Mapper Tuesday September 9th at 11:00AM!


Learn more about HealthLandscape with our online Webinars and Training

Thursday, August 20, 2015

21st Century Healthcare Demands Robust Health IT Workforce

The healthcare industry is facing a problem: shortages of health IT workers. This problem could loom even greater as changes in ICD codes roll-out this year. To combat this problem, the right tools and data can be used to identify some of the key drivers of these shortages and where these problems are likely to play out. We here at HealthLandscape can effectively address some of these issues by digging into data with new interactive and visually effective tools such as HealthLandscape Storymap that explores some of the characteristics of health IT workers and how they differ across the United States.

This first map (below) shows employment rates of Medical Records and Health Information Technicians by state. On average, states with higher employment rates (or lower unemployment rates) will have greater labor shortages. From quick glance at the map, we can see that clusters of high employment of Health IT workers appear in the Northern Rockies (Wyoming, Montana, North Dakota, and South Dakota), Northern New England (Vermont, New Hampshire, and Maine) and Hawaii. Conversely, employment rates are lowest in the south stretching from South Carolina to Florida. The rate of employment equals the number of employed workers divided by the total labor force (the number of employed workers plus the number of unemployed workers).
Figure. Employment Rates of Medical Records and Health Information Technicians by state
There tends to be an inverse relationship between employment rates and wages. This map shows median wages of full-time (30 hours or more per week) Medical Records and Health Information Technicians. On average, areas with higher employment rates of Medical Records and Health Information Technicians tend to have lower median wages. A way to potentially offset labor shortages for health IT workers is to increase wages where employment rates are high.
 Figure. Median wage of full-time Medical Records and Health Information Technicians by state
This map shows the average age of Medical Records and Health Information Technicians by state. On average, areas with higher average ages tend to have higher employment rates. This is striking because with an aging Health IT workforce in areas with labor shortages, labor shortages in these areas will become an even greater issue in the future.

Figure. Average age of Medical Records and Health Information Technicians by state.

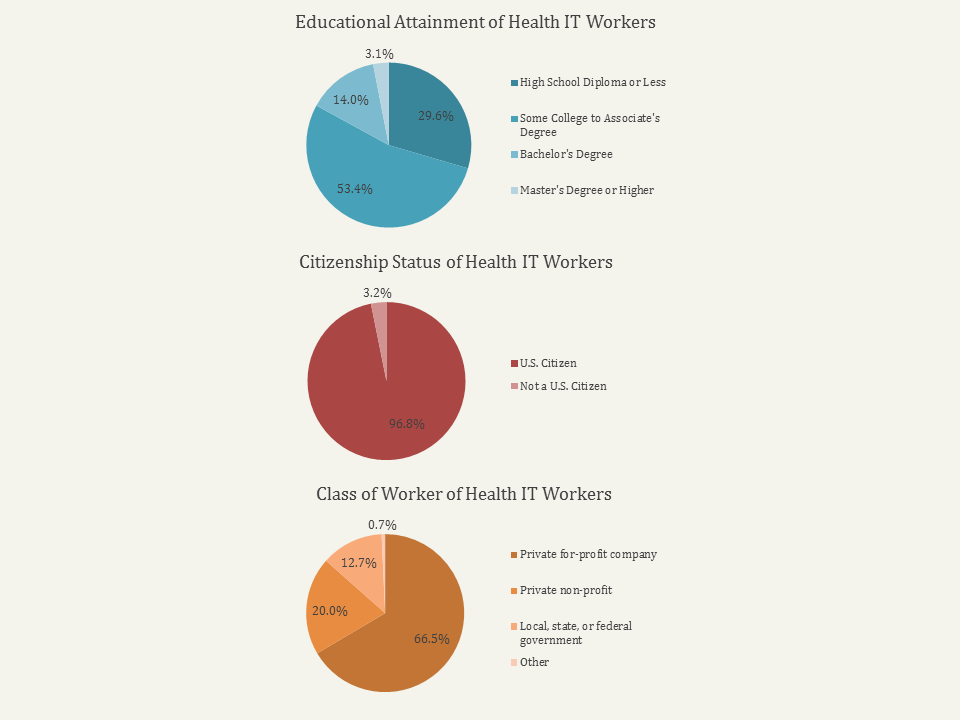
Finally, Health IT workers show some striking characteristics:
  • Nationally, the majority of health IT workers have less than a bachelor's degree, typically with either a high school diploma or some college education.
  • Nearly 97% of health IT workers are U.S. citizens.
  • Most health IT workers (66.5%) work for a private for-profit company followed by private non-profit companies (20%).

Paul Maliszewski 
GIS Strategist
HealthLandscape

To access the Healthcare Workforce Storymap, see 

Want to Learn More?

Learn more about HealthLandscape with our online Webinars and Training
In-depth instruction on using HealthLandscape tools and additions to our ever-growing data library


Tuesday, August 11, 2015

Report From Esri User Conference 2015


The Esri International User Conference takes place each summer in San Diego, California. The HealthLandscape application is built on the esri ArcGIS platform, so we regularly attend the conference to discuss our work and to stay current in esri technology and trends. It’s a great opportunity to mingle with other data geeks, learn some new tips and tricks, and see what kinds of new and exciting projects our peers are working on. As always, the agenda was packed full of interesting sessions, educational opportunities, and user group meetings.


This year, I had the opportunity to present two moderated session papers on behalf of the team. Both presentations discussed the importance of looking at patients in the context of their home communities, but from two very different perspectives; public health research and individual practitioners.

Accelerating Data Value Across a National CHC Network introduced the new HealthLandscape Geocode API, which allows organizations to append community and social determinants data to patient-level data: giving them a unique way to enrich their investigations of patient-centered outcomes. Appending these types of data will allow for the exploration of clinical and disease-oriented service areas, hotspots, and coldspots. The Community Context of Health Center Patients focused on how we can use population-based big data and geospatial technologies to understand the social and environmental influences on the health of a physician’s patient panel through the idea of Community Vital Signs - as patient vital signs provide a biometric snapshot of an individual’s health status, community vital signs provide an environmental health perspective. Taken together, we can improve the care that patients are receiving. Both of these projects will be featured as detailed blog posts in the coming weeks.

In addition to our paper presentations, HealthLandscape was once again recognized as one of the top three GIS applications in the User Conference Applications Fair. The HealthLandscape Population Health Mapper builds upon the idea of “Place Matters,” a concept discussed in a recent blog. Users can select county-level metrics from seven categories identified by the CDC as recommended Health Outcomes and Health Determinants, using a slider bar to set thresholds and easily identify counties that perform poorly compared to the national average. We've highlighted this tool on the blog and will be hosting a “Population Health Mapper” webinar on Wednesday, August 19th. Click here to register, or contact us by email for more information.


I always enjoy the time that I spend at the Esri User Conference and I never fail to return home with new collaboration opportunities, new skills, and new ideas. I’m thrilled to take home another HealthLandscape award this year, too.


Jené Grandmont
Senior Manager, Application Development and Data Services
HealthLandscape

Tuesday, August 4, 2015

How Place Matters to Health


How does Place Matter to the health of the public and the health of an individual?

I have a catch-phrase answer I use that says simply “Because Everything Happens Somewhere.”  This deceptively simplistic response actually hides a fair amount of complexity.  Where a person lives, where they spend many hours working during a year, and how they travel to and from their home and work all greatly impact their health and well-being.  Let’s look at a few examples.

Environmental Hazards

 Air quality can impact individual and population health.  Fine particles from automobiles, power plants, wood burning, industrial processes, and diesel powered vehicles such as buses and trucks may adversely impact air quality.  Research suggests deleterious effects including asthma, bronchitis, acute and chronic respiratory symptoms such as shortness of breath and painful breathing, and premature deaths (EPA).

HealthLandscape Community HealthView Data for Particulate Matter

Another example is a remnant of the Cold War and a byproduct of the Nuclear Arms race.  The U.S. has hundreds of factories and research facilities with potentially hazardous nuclear waste, the true health impact of which will not be known for many years.  You can learn more about these "Waste Lands" in this project of the Wall Street Journal.

Access to Healthcare Providers

Not everyone has equal access to health care providers, including primary care physicians, specialists, hospitals, specialty services, and pharmacies.  The HealthLandscape Healthcare Workforce Mapper can be used to learn where there are shortages of physician and non-physician providers.


Family Medicine Population to Provider Ratio, by County

Thinking Beyond the Individual

Place and the environmental can also have indirect, long-term effects on the health of people through the cascading impact on the food chain.  You may remember recent stories from the town of  Ribeauville in France, where beekeepers found their hives were producing blue and green and various colored honey.  It was discovered that the bees had begun feeding on waste from a local candy factory that was producing treats dyed in colors of bright red, blue, green, and yellow.  These dyes had been collected by the bees and deposited in the honey.  This colorful episode was not considered an immediate health concern -- though the honey was an economic loss because of the unnatural coloring.  However, it provides stark evidence of the impact environmental conditions miles away may have on the food chain and subsequently the health of people who consume that food.

Learning to Think Spatially

OK, so, how do I orient my thinking to recognize the possibilities of space and place on health?  Learning to think spatially is an ongoing process, but there are a few concepts that will help you start down the path to lifetime learning.

As a start, you should always consider What (Location), Where (Patterns among multiple Locations), and When (Temporal Relations -- how those Location(s) and Patterns changes over time).
  • What is the population you are studying?  Are you interested in individual congestive heart failure patients, failing students, older homes likely to have used lead-based paints?
  • Where are they in relation to one another and related locations?  How close are patients to clinics or hospitals, what is the travel (time or distance) to the nearest primary care provider, is there suitable public transportation in areas where households are less likely to have cars or areas of high traffic congestion?
  • How have these conditions changed over time?  What is the impact of the opening (or closing) of a primary care office, the loss of adequate bus transportation, the loss of specialized equipment or treatment services in a section of the city?
Learning to THINK spatially is an ongoing process, and we haven’t even talked about how to use Geographic Information Systems, or GIS, to help wrangle some of these concepts and ideas into manageable analysis and meaningful visualizations.  Take an opportunity to visit us at HealthLandscape (and sign up for one of our webinars) to see how GIS can help you understand how Place Matters to the health of your community.

Mark Carrozza
Director
HealthLandscape