Tuesday, February 7, 2012

HealthLandscape Tools - QuickMaps

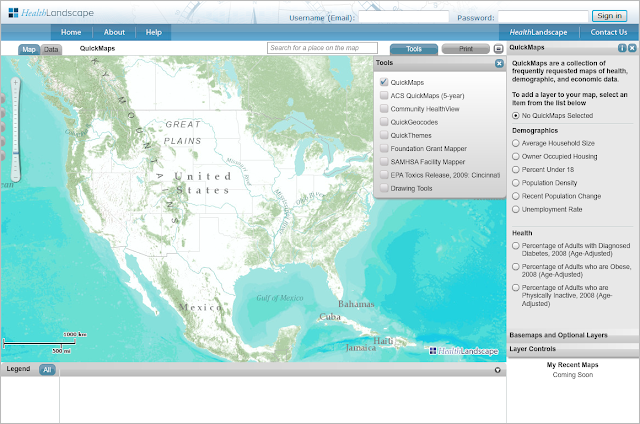
The newest version of HealthLandscape includes a feature called QuickMaps. QuickMaps is a tool that we've developed to help our users quickly and easily create maps of their communities.

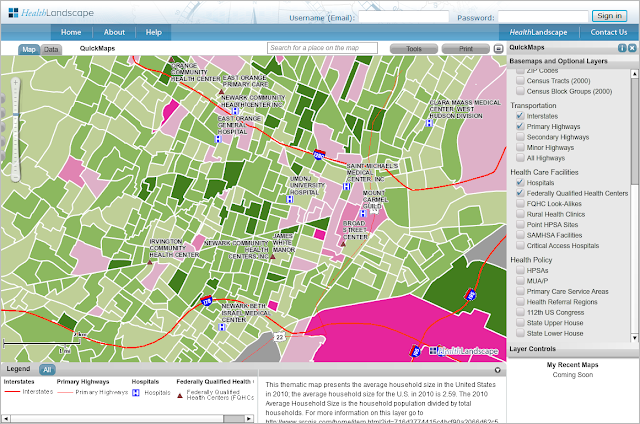
QuickMaps includes a collection of frequently-requested indicators with state, county, tract, and blockgroup (where available) level data. The QuickMaps module is turned on by default when you login to HealthLandscape, but it is also accessible in the tools menu.


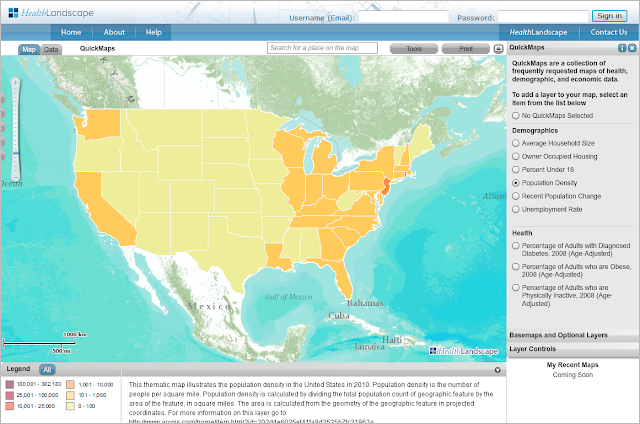
As you zoom in to smaller geographic areas, the map view will change from showing data at the state level...


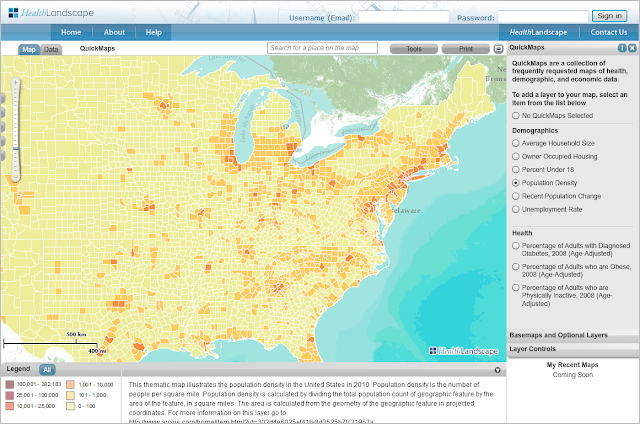
...to showing data at the county level...


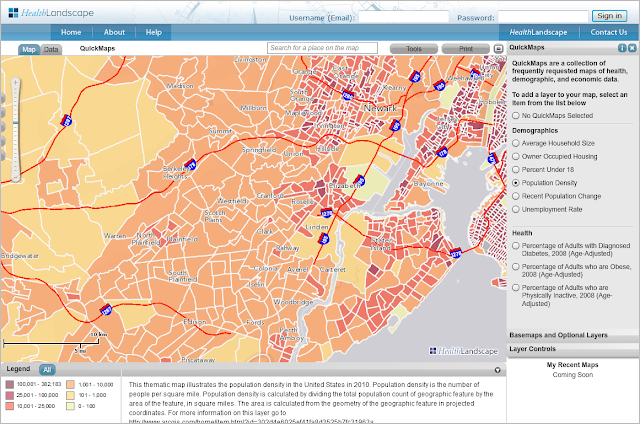
...to showing data at the census tract level and beyond, where available.


Basic Map Layers, including hospitals, health centers, geographic boundaries, and other features, can be added on top of the QuickMap selection to create more detailed maps.


Looking for data not currently featured in QuickMaps? Check out the American Community Survey (ACS) QuickMaps and Community HealthView. We will be detailing those tools in future blog posts!

Friday, November 11, 2011

HealthLandscape Webinar Series

Interested in learning more about the new features in HealthLandscape? Sign up for a free webinar session to hear about the tools and datasets available to our users.

Visit our webinar page for a list of dates, and times from now through December. There are currently three webinars being offered, as described below. We will be developing webinars on other special topics, including crime and economic datasets, in the coming months.


Introduction to HealthLandscape Geospatial Analysis
Health and community are tightly connected. HealthLandscape gives users the ability to create custom maps and tables of health in their communities - depicting populations at risk, health outcomes, and the distribution of health interventions. During this webinar you will learn to use the HealthLandscape interface, what data are available, and how to add your own data to create custom maps.

Using HealthLandscape with Census Data
Learn how to use data from the American Community Survey and other US Census Bureau datasets to create custom maps with HealthLandscape.

Using HealthLandscape with CDC and other Health Data
Learn to download CDC data and create maps with HealthLandscape.

Thursday, November 10, 2011

Introducing the New HealthLandscape

The Health Foundation of Greater Cincinnati and the American Academy of Family Physicians Release Major Upgrade to HealthLandscape.org Data Visualization Tool

CINCINNATI — The Health Foundation of Greater Cincinnati and the American Academy of Family Physicians (AAFP) announce a major upgrade to HealthLandscape.org, a web-based data visualization tool (www.healthlandscape.org) that allows healthcare payers, providers, policymakers, researchers, and community planners to perform spatial analysis on health-related data.

"We know that personal health is affected by many determinants outside our physical condition. For example, how does our community healthcare infrastructure, our social environment, our economic well-being affect our health?" asks Mark Carrozza, Health Informatics Developer at the Health Foundation of Greater Cincinnati and chief architect of the HealthLandscape.org tool. “HealthLandscape.org helps healthcare providers, payers, policymakers, and planners visualize the impact of such multiple factors on our health.”

In the past, health professionals needed to be highly specialized and extensively trained to make effective use of GIS (Geographic Information Systems) mapping tools. The new release of HealthLandscape has addressed many shortcomings of early systems. A few of the new features in this release include:
  • Ease of use - easily deployed by health professionals with modest information technology backgrounds
  • Pre-loaded datasets that include multiple factors affecting personal health with extensive ability to overlay several conditions on one screen (e.g. correlation of obesity and poverty)
  • Simple point-and-click access to health information. The data have already been uploaded
  • Quick maps, themes, and geocoding capabilities allow users to create maps almost instantly
  • Simple data upload capabilities that take output from electronic medical record systems or other database systems formatted as spreadsheets and pasted directly into HealthLandscape

"With HealthLandscape.org, users can upload their data through a simple spreadsheet, geocode it (turn addresses into mappable geographic coordinates) and then immediately create elegant, meaningful visual maps of that information," Carrozza says. "It’s a lot easier to see relationships in graphic form than it is to interpret data through tables or charts.”

Data visualizations created from a user’s own data are powerful. But HealthLandscape.org also provides superior access to public datasets through its new QuickMaps, QuickThemes, and Community Health View tools. Layering a user’s own data with public datasets such as average household size, percentage of the population in poverty, census data, transportation data, health professional shortage areas and other indicators offers insight not readily discernible any other way.

All maps can be stored on the web and made accessible wherever there is a web connection for use in reports, analyses, and presentations. “Adding graphic data to a presentation can quickly help users Show their Need, Tell their Story, and Explore Alternatives,” says Ed Carl, Executive Director of HealthLandscape, LLC.

HealthLandscape.org displays data from the national down to the neighborhood level in compliance with HIPAA data security requirements, thus ensuring confidentiality of all patient information.

HealthLandscape is a collaboration between The Health Foundation of Greater Cincinnati and the American Academy of Family Physicians. Both organizations are nonprofit enterprises that share the vision of improving the health condition of their constituents through better understanding of the underlying information that affects health.

“Our primary goal is to promote understanding and improvement of health and healthcare at all levels. HealthLandscape lets people become more involved in and better educated about the health of our communities,” says Pat O’Connor, Vice President and Chief Operating Officer of the Health Foundation of Greater Cincinnati. “Healthcare providers, grantees, and policymakers need powerful data and tools to inform their decisions. HealthLandscape.org can provide just those tools and data.”

"HealthLandscape can play a significant role for a much wider array of users to work with, display, share and benefit from community health data," said Andrew Bazemore, Assistant Director of the Robert Graham Center, American Academy of Family Physicians. "Policy makers think spatially. They look at maps and understand health in terms of their constituents in a way that simple tables do not permit. With HealthLandscape, health professionals in their communities will be able to use maps to better understand local issues and have the data needed to make more informed health policy decisions."


This map shows counties where obesity is a concern; darker shading means higher percentage obese.

*****
About the Health Foundation of Greater Cincinnati
The Health Foundation of Greater Cincinnati is an independent foundation dedicated to improving community health through grants, evaluation, and education. The Foundation works in Cincinnati and 20 surrounding counties in Ohio, Kentucky, and Indiana. For more information please visit www.healthfoundation.org.

About the American Academy of Family Physicians (AAFP)
The American Academy of Family Physicians is the United States’ national association of family physicians. It has more than 100,300 members in the 50 states and territories. The Academy was founded in 1947 to promote and maintain high quality standards for family doctors who provide comprehensive health care to the public. For more information please visit www.AAFP.org.

Tuesday, October 25, 2011

Esri Health GIS Conference


The HealthLandscape team had a strong showing at the Esri Health GIS Conference last month. Between us, we presented eight different papers about how we use the HealthLandscape family of applications to explore and address health-related issues. We'll be sharing the details on each of those presentations here on our blog over the next few weeks.

Wednesday, July 27, 2011

HealthLandscape and UDS Mapper Win First Place in Esri Application Fair

HealthLandscape and UDS Mapper took first place in the Web-Based GIS Application category at the Esri International User Conference's User Software Applications Fair. The full display included HealthLandscape Version 3, the UDS Mapper, and the Med School Mapper. Esri is the world leader in Geographic Information Systems. The Conference took place July 11-15 in San Diego and drew more than 15,000 GIS users. Application Fair prizes were awarded based on attendee voting.


Friday, April 1, 2011

CDC: Diabetes Surveillance System

New data available in HealthLandscape!

We have added the most recent data from the CDC Diabetes Surveillance System to HealthLandscape, both at www.healthlandscape.org and, in Quick Map form, at beta.healthlandscape.org. Variables include the Percent of Adults who are Physically Inactive, the Percent of Adults who are Obese, and the Percent of Adults who have Diabetes.

Figure 1. Percent of Adults Who Are Physically Inactive, 2008


Figure 2. Percent of Adults Who Are Physically Inactive, 2008 (HL3)


Diabetes Data and Trends, which includes the National Diabetes Fact Sheet and the National Diabetes Surveillance System, provides resources documenting the public health burden of diabetes and its complications in the United States. The surveillance system also includes county-level estimates of diagnosed diabetes and selected risk factors for all U.S. counties to help target and optimize the resources for diabetes control and prevention.

The prevalence of diagnosed diabetes and selected risk factors by county was estimated using data from CDC's Behavioral Risk Factor Surveillance System (BRFSS) and data from the U.S. Census Bureau’s Population Estimates Program. The BRFSS is an ongoing, monthly, state-based telephone survey of the adult population. The survey provides state-specific information on behavioral risk factors and preventive health practices. Respondents were considered to have diabetes if they responded "yes" to the question, "Has a doctor ever told you that you have diabetes?" Women who indicated that they only had diabetes during pregnancy were not considered to have diabetes. Respondents were considered obese if their body mass index was 30 or greater. Body mass index (weight [kg]/height [m]2) was derived from self-report of height and weight. Respondents were considered to be physically inactive if they answered "no" to the question, "During the past month, other than your regular job, did you participate in any physical activities or exercises such as running, calisthenics, golf, gardening, or walking for exercise?"

See the CDC Diabetes Surveillance System for more information.


Show the need.

Paint a portrait.

Tell the story.

Wednesday, March 9, 2011

New Webinar - Using the Med School Mapper

The American Academy of Family Physicians’ Robert Graham Center for Policy Studies in Family Medicine and Primary Care publicly launched the Med School Mapper project back in November, 2010 Josiah Macy, Jr. Foundation (for details, please refer to the initial annoucement here).

We are now scheduling webinars to showcase this unique tool. The first webinar will take place on Tuesday, March 15, at 2:00PM. Please visit the registration page to sign up for the online session.

Amidst AAMC and COGME recommended expansion of medical education, principally through expansion of existing training sites, there is little mention and measurement of how the large investments of public dollars meet the needs of the citizens. In response to this, the Macy Foundation is funding the Medical Education Futures Study. This response is consistent with Macy’s mission to promote and evaluate the social responsiveness and mission of each medical school. Its ranking of schools by social accountability criteria is a novel first step in considering their social impact on a national scale. However, as state policymakers attempt to direct expansion funding forecasting for their own regional social and health care access needs, they have few tools for understanding the local and regional impact of schools. Neither national rankings, nor workforce models can truly capture the regional impact of training sites. The Robert Graham Center has created the Med School Mapper to study the means of demonstrating such an impact, using geographic and policy analyses of individual medical schools’ graduates.